Video Completion Rate: The 2026 Guide to Boosting
Other

A 95.92% completion rate on 30-second Connected TV ads sits in a completely different world from the 41% completion that short-form platforms report for videos over 60 seconds in one 2026 dataset. That gap is the whole story, because it shows that video completion rate isn't a vanity score, it's a readout of whether the clip matched the viewing environment, held attention, and delivered the idea before the audience bailed. If you treat it as a diagnostic, you can usually tell whether the problem sits in the hook, the pacing, the edit length, or the platform choice.
Why Video Completion Rate Is the Metric That Actually Matters
A high view count can hide a weak message. Likes, reach, and even raw views only show that someone noticed the clip, not that they stayed long enough to absorb the point. Completion rate shows whether the message survived contact with the audience, which is why it works better as a diagnostic than a vanity score.
On a major 2024 benchmark, Connected TV led every device category, with 30-second ads completing at 95.92%, 15-second ads at 93.88%, and 10-second-or-shorter ads at 90.4% Marketing Charts benchmark. Desktop landed at 82.66% for ads of 10 seconds or less, 76.26% for 15-second ads, and 74.23% for 30-second ads, while mobile sat at 75.44%, 68.83%, and 72.26% respectively Marketing Charts benchmark. The same benchmark also shows how quickly the metric falls apart when the ask outgrows the setting, with very long ads dropping sharply on CTV and even more on mobile Marketing Charts benchmark. That spread is the point. Completion rate reflects both the creative and the environment it enters.
Why the number behaves the way it does
Completion rate drops when the clip demands more patience than the viewer is willing to give. If the payoff arrives too late, the audience leaves before the idea is fully delivered, even when the topic itself is strong.

Practical rule: if the viewer does not reach the payoff early, completion falls even when the concept is sound.
Google's reporting defines completion rate as the percentage of video plays that reach the end, calculated as completed views divided by video starts Google Ad Manager help. That definition matters because it makes the metric sensitive to both creative length and early drop-off behavior. In practice, completion rate tells you whether the clip earned the right to keep speaking.
How to Calculate Video Completion Rate Step by Step
The formula is simple, but the readout is not. Video completion rate is completed views divided by video starts, then multiplied by 100 if you want a percentage. Google's reporting uses the same basic definition, but that number is only the starting point Google Ad Manager help. A 10-second clip and a 90-second clip can produce the same completion rate and still tell very different stories.
Use the platform number, then qualify it
Most dashboards show a platform-reported completion rate, usually tied to 100% completions. That is useful for a quick read, but it can hide the difference between a viewer who watched almost the entire clip and one who dropped out halfway through a shorter one. Umbrex recommends separating platform-reported completions from qualified completions and pairing raw completion rate with Average Percentage Viewed plus a Length-normalized Completion Index to control for video length effects Umbrex guidance.
A practical workflow looks like this:
- Pull starts and completed views from your platform analytics.
- Calculate the raw completion rate from those two values.
- Check qualified completions, especially if the platform exposes near-finish watches.
- Add Average Percentage Viewed so longer clips do not get unfairly punished.
- Normalize by length before comparing one asset to another.
A 40% completion rate on a long clip can mean something very different from a 40% completion rate on a short clip. Without a length-normalized view, you are grading different tests with the same answer key.
Track the number where audience behavior is visible
Google's reporting also points operators toward the part of the timeline that matters most. Because completion rate is sensitive to early drop-off, you need retention checkpoints at specific moments to see where the audience thins out Google Ad Manager help. If you only track the final number, you will know the clip failed, but you will not know where viewers left.
That is why I treat completion rate as the outcome, not the diagnosis. The diagnosis comes from the checkpoints, and from whether the clip is normal for its length. For short-form assets, Klap's guidance on how long Reels should be is useful as a length check before you compare performance across edits.
Platform and Device Benchmarks You Should Compare Against
Completion rate only becomes useful when you compare it against the right surface. A clip can look strong on one device and weak on another because the viewer's context changes the way people watch, pause, and leave. The same edit can also behave very differently across platforms even when the topic is identical.
Device context changes the baseline
Device still matters before platform does. As noted earlier, CTV outperformed the other measured devices in the benchmark set, while desktop and mobile trailed and the gap widened as runtime increased. That pattern is the reminder that a completion number without device context can mislead the team reading it.
If your content team is lining up mobile shorts against CTV ads, the comparison is already broken. The viewing environment, intent, and tolerance for slower pacing are not the same, so the completion rate is not measuring the same thing.
Platform choice matters just as much
Short-form platforms bring their own baseline. Contentmation reports TikTok at 64% average short-form completion and YouTube Shorts at 58% Contentmation short-form benchmark. That gap does not mean one channel is stronger. It means the edit length, hook style, and audience expectation are different enough that you should not paste one benchmark onto another channel and call it a strategy.
Completion Rate Benchmarks by Platform and Video LengthPlatform or DeviceUnder 20 secondsAround 30–60 secondsOver 60 seconds
Completion Rate Benchmarks by Platform and Video Length
CTV
Very high on short ads
Still high for shorter ads
Drops sharply as runtime stretches
Completion Rate Benchmarks by Platform and Video Length
Desktop
Stronger than mobile on short ads
Mid-range compared with CTV
Declines as runtime increases
Completion Rate Benchmarks by Platform and Video Length
Mobile
Strong on compact creative
Lower than desktop in the benchmark
Falls hard on very long ads
Completion Rate Benchmarks by Platform and Video Length
TikTok
High for short-form clips
Best when the edit stays tight
Long clips generally lose momentum
Completion Rate Benchmarks by Platform and Video Length
YouTube Shorts
Strong for compact edits
Works when the hook comes fast
Longer runtimes need a stronger reason to stay
That table is useful only if you read it as a filter, not a target. A clip with solid completion on YouTube Shorts can still be too slow for TikTok, even when the idea is good. The benchmark tells you whether the edit fits the surface, not whether the idea deserves to exist.
For a practical check on short-form length before you compare edits, this guide on how long Reels should be fits with the platform differences above.
Diagnosing Drop-Off With Retention Checkpoints
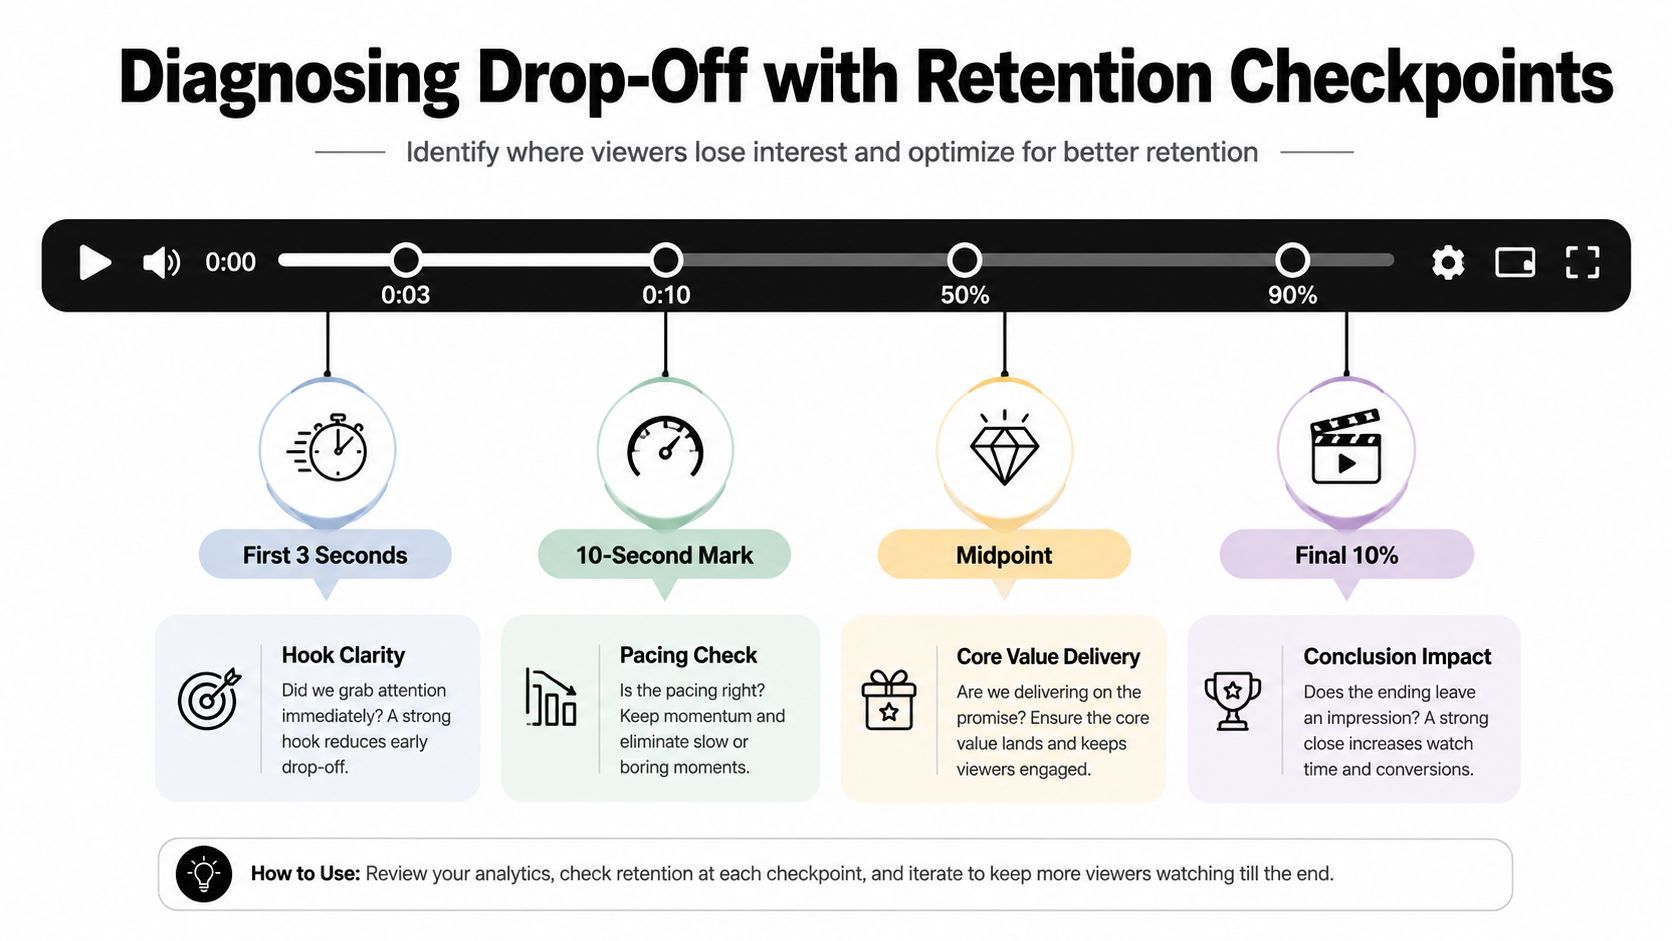
One completion number tells you almost nothing unless you know where the audience left. The useful move is to turn the curve into checkpoints, then match each drop-off to a likely creative fault. That's how you stop treating completion rate like a scoreboard and start using it like a diagnostic tool.
Start with the first three checkpoints
The first 3 seconds usually tell you whether the hook is doing its job. If people vanish there, the opening is slow, vague, or too self-referential. The 10-second mark is where pacing usually gets exposed, because viewers have already decided whether the clip is getting to the point.
By the time you reach 25%, 50%, 75%, and 95% of the timeline, you're no longer asking whether the clip is interesting in the abstract. You're asking whether the value delivery stayed visible all the way through. Google's reporting encourages this style of checkpoint analysis because completion rate is affected by early drop-off, which means the curve matters more than the ending alone Google Ad Manager help.
Read the failure mode, not just the dip
A few patterns show up over and over:
- First 3 seconds drop: the hook didn't state a reason to stay.
- 10-second drop: the intro took too long to reach the core point.
- Midpoint drop: the clip drifted, repeated itself, or lost forward motion.
- Late-stage drop: the payoff came too late or felt smaller than the setup.
That mapping matters because each fix is different. A weak hook needs a new opening. Mid-clip boredom needs tighter pacing. A late drop often means the clip buried the most useful part too deep.
Practical rule: don't say “completion is low” until you can name the exact checkpoint where the audience started leaving.
If you want a second lens, the retention logic pairs well with this guide on how to increase watch time, because watch time and completion curve analysis are different views of the same problem. One tells you how long people stayed, the other tells you where they exited.
Tactics That Actually Lift Completion on Repurposed Shorts
Repurposed clips fail for boring reasons. The hook waits too long, the speaker rambles through setup, the frame doesn't suit vertical viewing, or the captioning hides the point instead of reinforcing it. The fix isn't “make it shorter” in the abstract, it's to change the exact segment that's causing the drop-off.

Match the edit to the point where viewers leave
If people drop in the first 3 seconds, rewrite the hook so the clip opens on the claim, the problem, or the payoff. If they fall off around 10 seconds, cut the brand preamble, remove the pleasantries, and move the point up. If the dip lands near the midpoint, tighten the pacing by removing repeated phrases, dead air, and side stories.
Other fixes map just as directly:
- Reframe for vertical when the speaker isn't visually anchored, because poor framing makes short-form clips feel improvised.
- Use on-screen text and captions when the viewer needs a fast comprehension cue, especially on mobile.
- Cut intros and outros when the clip spends too much time explaining itself.
- Use pattern interrupts when the middle is flat, because the content needs a visual or tonal reset.
- Remove brand preambles when the audience is leaving before the idea starts.
Each tactic solves a different retention failure. That's why generic editing advice usually disappoints.
Keep the workflow focused on the real bottleneck
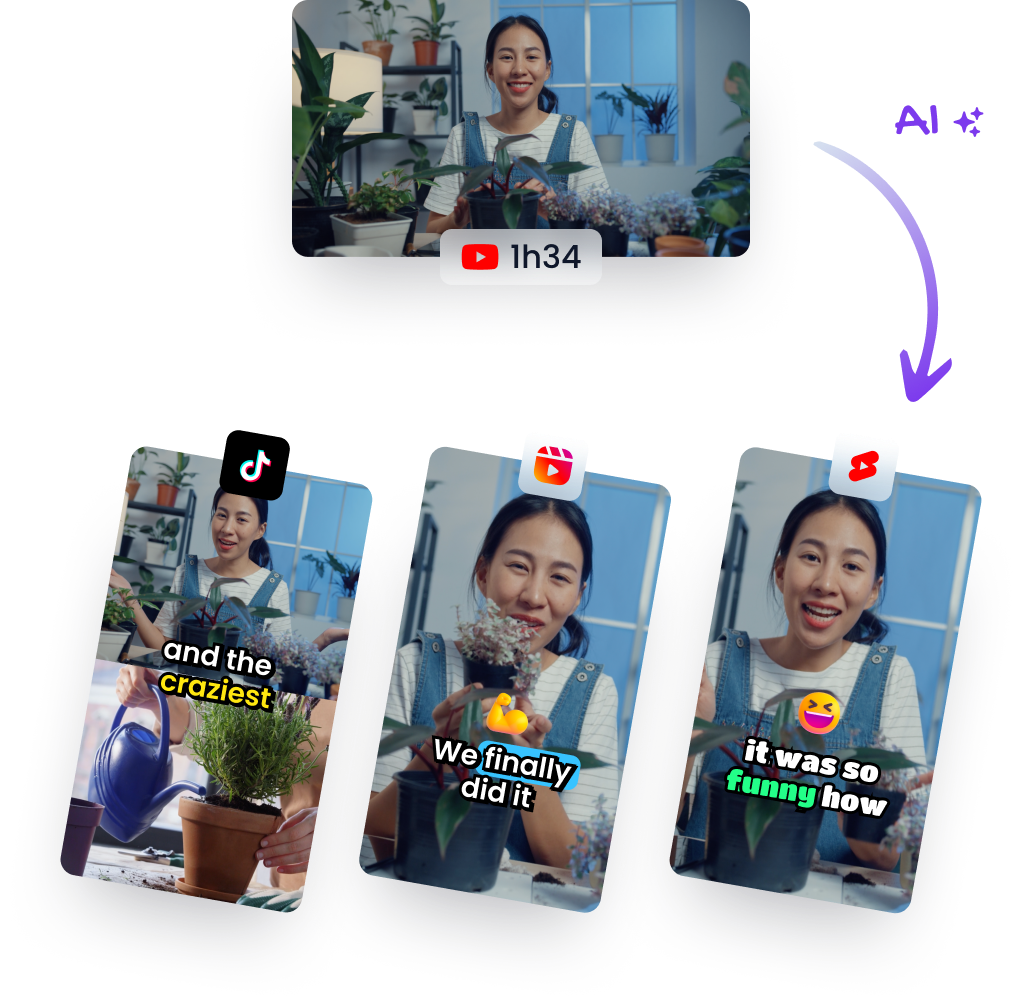
The most efficient repurposing systems handle the mechanical work first, then leave the human editor free to improve the hook and pacing. Klap is one option in that category, because it can scan a long video, identify candidate hooks, reframe for vertical, add captions, and generate short clips for review. Used well, a tool like that reduces the time spent on mechanical formatting, which gives the editor more room to fix the actual drop-off point.
If the clip is losing people early, the caption style should be judged by clarity, not decoration. If the loss happens later, the editor should focus less on visual garnish and more on whether the payoff arrives in time. The smartest repurposing teams don't ask, “How do we make this prettier?” They ask, “Which checkpoint is failing, and what edit changes it?”
A Real Repurposing Workflow That Lifts Completion
A 25-minute podcast segment rarely holds up if you only trim the ends and export it. Repurposing works better when the source is split into multiple clip candidates, because each length exposes a different retention failure. Completion rate becomes useful at this stage because it separates weak hooks from weak pacing and weak endings.
A practical clip pipeline
A creator uploads the long-form episode, scans for the strongest hooks, and turns the source into vertical 9:16 clips. The transcript gets captioned, the frame gets centered, and the timeline gets cut into three short candidates, roughly 18 seconds, 32 seconds, and 55 seconds. Those lengths are not interchangeable, because each one produces a different completion pattern on short-form platforms.
The 18-second cut usually rises or falls in the opening few seconds. If the hook is sharp, viewers may stay long enough to reach the point before the clip ends. The 32-second version needs cleaner pacing, because that length gives people enough time to notice drift. The 55-second version has the hardest job, since it has to hold attention longer without letting the middle sag.
The final edit depends on the weakest checkpoint
Before publishing, the creator usually makes one of three changes. They rewrite the first line to make the value obvious, remove a stalled section that drives midpoint drop-off, or tighten the ending so the payoff arrives before attention fades. The right edit depends on which checkpoint failed during review.
A workflow note from Klap's process standardization guidance fits here, because repeatable clip generation only helps if the editor still has a clear review standard. Automated reframing and captioning handle the repeatable parts, but the retention curve still tells you where human judgment matters.
Keep the workflow focused on the bottleneck
The point is not to create more clips for the sake of volume. It is to produce candidates that already match the likely drop-off point. When a team works that way, completion rate stops being a postmortem metric and starts shaping the edit before publication.
That also changes how the review process works. If the early curve falls off, the editor looks at the hook and the first caption line. If the middle loses people, the problem is usually pacing or missing context. If the ending drops, the payoff is arriving too late or too softly. The workflow should follow the failure point, not a generic editing checklist.
What a Good Completion Rate Looks Like in 2026
There isn't one good completion rate. A healthy number depends on length, platform, and objective, and the wrong benchmark can make a decent clip look weak or a poor clip look fine. The safer rule is to judge the number against the right context, then use the curve to improve the next cut.
Use context before judgment
The 2026 picture is clear enough to avoid guesswork. Short-form videos under 60 seconds were reported at 85% completion in one dataset, while mid-length videos at 1 to 10 minutes came in at 62% and long-form videos over 10 minutes at 38% Digital Applied 2026 summary. A separate 2026 source, citing Wistia 2024 data, put videos under 1 minute at about 80% completion, while another benchmark said videos under 20 seconds averaged 68% and videos over 60 seconds fell to 41%. Taken together, those ranges do not define a universal target. They define the band you should expect by format, and they make length-normalized comparison more useful than a raw finish rate.
A practical internal checklist looks like this:
- Compare by length first.
- Compare by platform second.
- Read the retention checkpoints before the final number.
- Decide whether the goal is finish rate, click-through, or downstream action.
Completion rate also should not be the only metric you care about. A clip can finish well and still fail to drive clicks, saves, or comments, while another clip can hold viewers for less time and still move them deeper into the funnel. That is why completion rate works best as a diagnostic, not a verdict. Pair it with retention checkpoints to see whether the hook, the middle, or the ending is doing the damage, then compare the clip with a length-normalized index so a 20-second cut is not judged like a 2-minute cut.
If you are repurposing long-form into short-form, the better question is not “What is a good completion rate?” It is “What does this completion curve say about the edit, and which checkpoint should I fix next?”
If you want to turn long videos into clips that are easier to diagnose and faster to iterate, Klap can handle the mechanical steps like hook detection, reframing, and captioning. Use it to move faster, then judge every export by the checkpoint where viewers fall away.