How to Measure Video Marketing ROI and Improve It
Other

82% of marketers reported good returns from video in 2026, but that figure fell from 93% in 2025, according to Wyzowl's 2026 video marketing statistics. That drop matters. Video still performs, but “we published a clip and it got views” is no longer a credible explanation of video marketing ROI.
The harder problem sits after publication. A podcast becomes a vertical clip, the clip appears on TikTok, Instagram Reels, and YouTube Shorts, and a viewer converts later through a branded search or a direct visit. Platform reporting rarely connects those events cleanly. The result is a familiar reporting failure: teams optimize for the channel that claims the conversion, not necessarily the asset that created demand.
A useful measurement system assigns value across the journey. It separates production cost from distribution cost, distinguishes engagement from commercial impact, and treats assisted conversions as evidence rather than noise.
What Video Marketing ROI Actually Means in 2026
Video marketing ROI is the value generated by a video asset minus the full cost of producing, distributing, and measuring it, divided by that same cost. The formula sounds simple, but teams often leave both sides undefined.
The numerator might mean booked revenue, recognized revenue, qualified pipeline, or the modeled value of leads. Those aren't interchangeable. A product demo should usually be judged against conversions or pipeline, while an awareness clip may contribute earlier in the journey and require an assisted-value model.
The denominator needs equal discipline. Include editing labor, creative review, captioning, tools, media spend, landing-page work, and the reporting time required to understand performance. If a team counts only the ad budget, it reports a media efficiency metric, not full video marketing ROI.
Practical rule: Define the business outcome and every cost category before the first clip is published.
The Wyzowl benchmark provides useful context, not a substitute for campaign accounting. 82% of marketers said video gave them good ROI in 2026, compared with 93% in 2025 (Wyzowl). The majority still saw positive returns, but the decline suggests that competition for attention and budget has raised the standard.
Why ratios beat vanity metrics
Views, likes, and watch time can diagnose creative performance. They don't prove that a campaign made money. A clip can attract attention from people who'll never buy, while a lower-reach clip can influence high-intent prospects.
Use a ratio when making budget decisions:
- Positive ROI: Value generated exceeds total cost.
- Break-even ROI: Value generated equals total cost.
- Negative ROI: Total cost exceeds assigned value.
The ratio also makes comparisons fairer. A high-volume campaign with expensive production shouldn't automatically beat a smaller campaign that creates more value per dollar. Measurement is the control system. Creative is only one input.
The Core Formula and a Worked Example
Use both percentage and ratio formats in your spreadsheet:
ROI percentage = (Attributed value − Total cost) ÷ Total cost × 100
ROI ratio = Attributed value ÷ Total cost
The first format shows gain or loss relative to investment. The second makes channel and asset comparisons easier. Keep the formulas visible rather than burying them in a dashboard.
Build the denominator first
Suppose a team repurposes a recorded webinar into short-form clips. The campaign has these internally assigned costs:
- Production and planning: $1,200
- Editing and review: $800
- Captioning and creative tooling: $300
- Paid distribution: $1,500
- Measurement and reporting: $200
The total cost is $4,000. These figures are a worked example, not a benchmark. The point is to expose costs that performance reports often omit.
The campaign records $5,000 in directly tracked revenue. A separate review finds that some buyers viewed a clip, returned later through another channel, and converted without clicking the original post. The team assigns $1,000 of assisted value using a documented rule. Attributed value therefore equals $6,000.
Separate gross from net
Gross ROI before overhead is:
($6,000 − $3,800) ÷ $3,800 × 100 = 57.9%
That calculation excludes the $200 measurement cost. Net ROI is:
($6,000 − $4,000) ÷ $4,000 × 100 = 50%
The difference isn't cosmetic. If every campaign excludes recurring labor and tooling, the team gradually overstates performance and underprices future production.
Record the direct and assisted components separately. Don't hide the assisted factor inside one unexplained revenue cell. A reviewer should be able to change the attribution assumption and see how sensitive the result is.
Audit question: If the assisted value disappeared, would the campaign still meet its objective?
That question doesn't eliminate upper-funnel value. It forces the team to label modeled value clearly and compare it with directly observed outcomes.
Metrics That Actually Move the ROI Needle
A useful dashboard groups metrics by the decision they support. Cost metrics tell you what efficiency costs. Engagement metrics explain whether the creative earns attention. Commercial metrics connect that attention to business value.

Cost metrics
Cost per view helps compare distribution efficiency, but it can reward cheap, low-intent reach. Cost per lead is more useful when the form and lead definition remain consistent across campaigns. Cost per acquisition is closest to commercial efficiency, provided the conversion window and attribution rule don't change between platforms.
These metrics belong mainly to distribution and lower-funnel decisions. They break when one platform reports view-through activity differently from another, or when a lead has sharply different expected value.
Engagement metrics
View-through rate signals whether the opening earns attention. Watch time and completion behavior help identify where the edit loses people. Shares and saves are stronger signs of utility or resonance than passive views, but neither proves purchase intent.
Short-form creative often wins this comparison structurally. Videos under 60 seconds generate 2.5 times more engagement per impression than other content types, according to Digital Applied's 2026 video marketing data. The likely explanation is reduced friction in the opening seconds, not necessarily superior subject matter.
That distinction matters. Higher engagement can make a clip a better distribution unit, but the team still needs to test whether the resulting attention moves people toward a commercial action. For a deeper diagnostic on audience retention, use this guide to video completion rate.
Commercial metrics
Click-through rate measures movement from the platform to the next owned destination. Conversion lift asks whether exposed users convert more often than an appropriate comparison group. Assisted revenue records influence that doesn't appear in last-click reporting.
A small team can avoid dashboard overload with a minimum set:
- Cost: Total cost, cost per lead, and cost per acquisition.
- Attention: View-through rate, average watch time, and saves or shares.
- Business: Click-through rate, attributed conversions, assisted value, and net ROI.
Track the same definitions every week. A stable imperfect metric is more useful than a detailed metric that changes meaning from one report to the next.
Platform Benchmarks You Can Compare Against
Benchmarks should guide creative decisions, not dictate them. Socialinsider's 2025 social video benchmarks report different high-performing lengths by platform, which means one source video shouldn't be exported identically everywhere.
PlatformBest-Performing LengthEngagement BenchmarkROI Ranking
TikTok
Around 2 minutes
Videos around 2 minutes perform best for engagement and views
Short-form video is part of the leading ROI format class
Instagram Reels
60 to 90 seconds
Reels in this range receive the most engagement and views
Short-form video is part of the leading ROI format class
YouTube Shorts
Platform-specific testing required
No specific length benchmark provided in the supplied data
Short-form video is the leading ROI-driving content format overall
The same Socialinsider benchmark says smaller accounts tend to earn higher engagement rates on Reels and TikTok. That makes account size a context variable. A large brand shouldn't use a smaller creator's engagement rate as a direct spending target, and a small account shouldn't assume limited reach means weak creative.
The broader format ranking is more decisive. HubSpot's 2026 State of Marketing data, summarized by Shopify, places short-form video at 49%, ahead of long-form video at 29% and livestreaming at 25% among ROI-driving content formats.
Turn benchmarks into repurposing choices
Use the long-form source as the subject-matter library, then adapt the cut for the destination. A sustained explanation may fit Reels' 60-to-90-second range, while TikTok can support a longer argument around two minutes. Shorts should earn its own tests rather than inherit assumptions from another platform.
Don't call a benchmark a target until you define the denominator. Engagement rate, cost per acquisition, and net ROI answer different questions. Set a platform-specific creative hypothesis, publish consistently enough to compare like with like, and judge commercial results against your own historical baseline.
The Attribution Problem No One Wants to Talk About
A short-form clip often sits in the middle of a chain rather than at the end of it. A viewer discovers a podcast excerpt on TikTok, sees a reframed version on Reels, watches a related Short, and later converts through a direct visit. A last-click report gives the final visit all the credit and makes the earlier video look unproductive.
The MMA Global report on video and CTV identifies fragmented measurement and attribution as persistent barriers, alongside insufficient creative adaptation. That combination explains why repurposed video can generate real influence while platform reports disagree about its value.

Three workable layers
Post-click tracking is the foundation. Use consistent campaign, source, medium, content, and asset identifiers in every link. Keep the original source asset ID attached when the footage becomes a clip, so the report can connect the derivative to the podcast, webinar, or interview that supplied it.
Multi-touch attribution assigns fractional credit across meaningful interactions. A position-based model can give more weight to the first and final touch, while a linear model distributes credit more evenly. Neither is “the truth.” Each is a declared assumption that should be tested against business outcomes.
Incrementality testing asks the question attribution tools can't answer alone: did the video cause additional conversions? Hold out a comparable audience from one paid campaign, compare outcomes, and treat the difference as incremental impact. The design won't be perfect, but it protects the team from claiming conversions that would've happened anyway.
On-site behavior adds another measurement layer. One video conversion benchmark compilation reports average landing-page conversion of 4.8% with video versus 2.9% without video, a 65% relative lift. The result doesn't prove every embedded video will produce that outcome. It does show why social exposure and on-page video should be evaluated as connected experiences, especially when the clip matches the landing page's promise.
Measurement warning: A low reported ROI can reflect broken credit assignment, not weak creative.
Sample Reporting Template for a Small Team
A practical report should fit in a spreadsheet or Notion database. Use one row per asset and preserve the relationship between the original source and every derivative clip.
FieldWhat to record
Source asset
Podcast, webinar, interview, or upload identifier
Campaign
Objective, audience, offer, and conversion window
Platform
TikTok, Reels, Shorts, or paid placement
Spend
Production, editing, tooling, media, and reporting cost
Cost metrics
Cost per view, lead, and acquisition
Engagement metrics
View-through rate, watch time, shares, saves
Commercial metrics
Click-through rate, direct conversions, assisted value
Outcome
Gross ROI, overhead, net ROI, attribution model
Run the asset-level report weekly while a short-form campaign is active. Review the consolidated channel and source-asset view monthly, because one platform may create early engagement while another captures later conversions.
Keep the review operational
Flag outliers instead of averaging them away. If one clip generates an unusually large share of attributed revenue, inspect its hook, topic, audience, landing page, and distribution path. Don't just duplicate it. Test the underlying reason it worked.
Use workflow standardization to keep naming, review stages, and reporting fields consistent. A repeatable process makes creative learning visible and turns reporting into a short operating task rather than a separate analytics project.
Tactics That Lift Video Marketing ROI in Practice
The most efficient improvement usually comes from changing the production-to-distribution system, not polishing every frame. HubSpot's format ranking puts short-form video first at 49%, ahead of long-form video at 29% and livestreaming at 25%, as reported by Shopify's video marketing statistics. That supports a channel-mix decision: get more usable short-form assets from material you already own.
Repurpose before commissioning
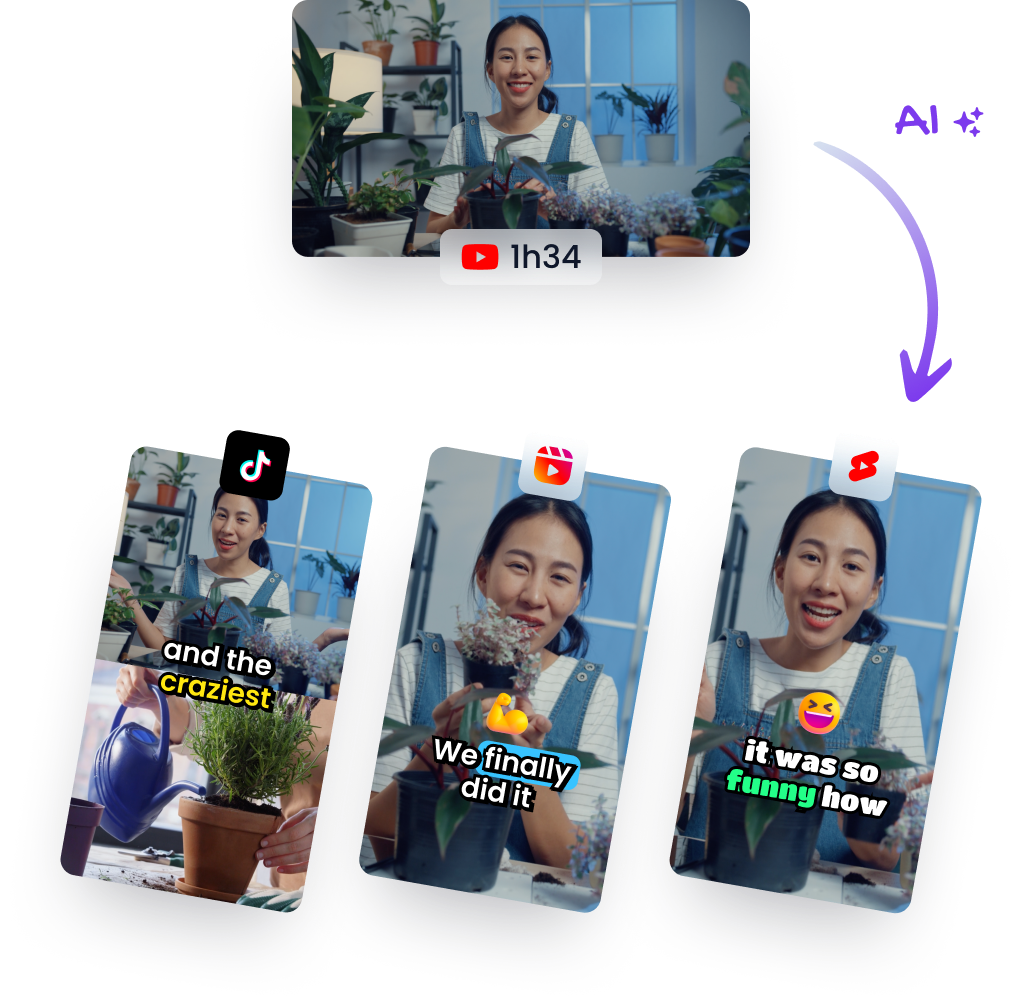
A long-form interview, webinar, or podcast can supply multiple topic angles. A tool such as Klap can analyze long-form footage, identify segments, reframe them vertically, add captions, and prepare social-ready clips for review. The economic case is straightforward: reuse can reduce the amount of new recording and editing required per distribution unit, although the resulting clips still need human quality control.
Test the opening, not just the finish
Create structured hook variations around the same core point. Change the first spoken line, opening visual, caption treatment, or question while keeping the offer and audience stable. Thumbnail and cover tests can help on platforms where users make a quick decision before watching.
Creative rule: Test one meaningful variable at a time when you want a usable lesson.
Adapt distribution to the platform
Publish organically on TikTok and Reels before increasing paid support for a promising concept. Use the platform-specific length guidance covered earlier, then adjust pacing, captions, framing, and calls to action rather than reposting a single master file everywhere.
For campaigns that move viewers toward a form or purchase, compare the social creative with PPC landing pages with video. The page should continue the same argument as the clip. A strong video followed by a mismatched landing page creates a measurement problem and a conversion problem at the same time.
A two-week quick-win list:
- Caption every clip: Preserve comprehension in sound-off environments.
- Reframe vertically: Keep the speaker, product, or demonstration visible on mobile.
- Front-load the hook: Put the clearest payoff at the beginning.
- Label every asset: Carry the source ID into platform and CRM reporting.
- Amplify selectively: Put paid spend behind concepts that show both attention and commercial promise.

Building a 30-Day Plan to Improve Your ROI
A month is enough to repair the measurement foundation and produce an initial creative learning loop. Don't start by increasing spend. Start by making the result observable.
Week one measurement setup
Define attributed value, total cost, conversion windows, and the net ROI formula. Select the platform comparison points relevant to your audience, then build the spreadsheet with a source-asset ID, platform fields, engagement metrics, commercial outcomes, and attribution assumptions.
Week two attribution hardening
Add consistent UTMs to every post-click destination. Create a simple multi-touch view alongside last-click reporting, then run one holdout test on a paid campaign if the audience and budget allow it. Record what each model claims rather than replacing one imperfect model with another.
Week three creative iteration
Choose the three strongest existing long-form assets based on business relevance, not just audience size. Turn them into short-form clips, test distinct hooks, apply vertical framing and captions, then publish versions adapted to TikTok, Reels, and Shorts.
Week four review
Compare actual net ROI with the benchmark and your own baseline. Retire formats that consume resources without commercial evidence, keep testing assets that earn qualified attention, and increase distribution only when the attribution view supports the decision.

The next action is specific: create the reporting sheet, assign every cost, and attach an identifier to the next clip before it goes live. Better video marketing ROI comes from measurement discipline, clearer attribution, and faster learning, not from spending more blindly.
Klap turns long-form videos into social-ready short clips with AI-assisted segment selection, vertical reframing, captions, and editing controls. Visit Klap to repurpose an existing podcast, webinar, or YouTube video and connect each clip to the reporting system described above.